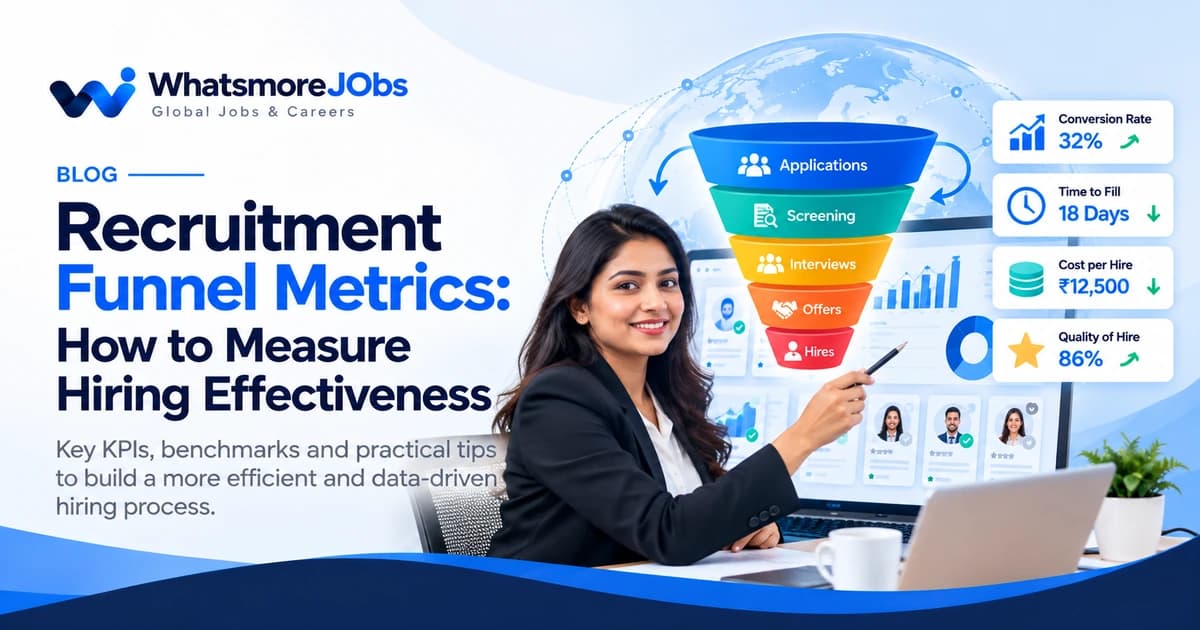
A recruitment funnel is more than a count of applications. It shows how people move from discovering a vacancy to applying, meeting the role criteria, interviewing, receiving an offer and joining. Measuring the conversion between these stages helps a hiring team find friction, improve candidate communication and spend recruiting time where it has the greatest effect.
The useful question is not simply “How many applicants did we get?” It is “How many suitable candidates reached the next stage, how long did that take, and what prevented others from progressing?” SHRM’s recruiting guidance highlights the value of stage-by-stage conversion and source quality alongside traditional measures such as time-to-fill and cost-per-hire.
1. Map the stages before choosing KPIs
Use stages that match your actual process. A practical starting point is:
- Reached: people who viewed or were reached by the vacancy, where reliable tracking exists.
- Applied: completed applications received for the role.
- Qualified: applicants who meet the essential, job-related eligibility criteria.
- Screened or assessed: qualified candidates who complete the relevant screening step.
- Interviewed: candidates who attend an interview or structured assessment.
- Offered: candidates who receive a formal offer.
- Accepted and joined: candidates who accept and, separately, actually start.
Define each stage consistently. For example, decide whether “interviewed” means scheduled or attended, and whether “hire” means offer accepted or first day completed. Mixing definitions makes comparisons unreliable.
2. Core recruitment funnel metrics and formulas
Stage conversion rate
Formula: candidates who reach the next stage ÷ candidates who entered the previous stage × 100.
Calculate it for each transition, such as application-to-qualified, qualified-to-interview, interview-to-offer and offer-to-acceptance. A low rate is a signal to investigate—not proof that a recruiter or channel is failing. Check role requirements, candidate expectations, assessment consistency and timing before changing the process.
Qualification rate
Formula: qualified applicants ÷ total completed applicants × 100.
This helps assess whether job ads and sourcing channels attract people who match the essential requirements. A low rate may point to unclear eligibility, broad targeting or a mismatch between the advertisement and the actual role.
Interview attendance rate
Formula: candidates who attend ÷ candidates with confirmed interview bookings × 100.
Track cancellations and no-shows separately where possible. Reminders, accessible scheduling, clear location or video instructions, and realistic descriptions of the role can help explain changes in attendance.
Offer acceptance rate
Formula: offers accepted ÷ offers made × 100.
Use the same offer cohort and time window in both parts of the calculation. Review declined offers by reason—such as pay, location, work arrangement, timing or unclear terms—rather than assuming every rejection has the same cause.
Time-to-fill and time-to-hire
These terms are not defined identically by every organisation. Choose a start event and end event, document them, and keep the definitions stable. For example, time-to-fill can measure approved requisition to accepted offer, while time-to-hire can measure a candidate’s entry into the process to offer acceptance. Report median as well as average where a few unusually long vacancies distort the result.
Source quality
Record the source for each applicant and compare more than raw application volume. Review how many candidates from each source qualify, attend interviews, receive offers, accept and join. A channel with fewer applicants can be more useful if it consistently produces candidates who meet the role criteria.
Cost per hire and quality after joining
Cost per hire is usually calculated as the recruiting costs included in your documented policy divided by hires in the same period. State which internal and external costs are included. To understand quality after joining, consider role-relevant performance, retention at a defined checkpoint, manager feedback and candidate experience. No single measure fully describes hiring quality.
3. Worked example: find the bottleneck
Suppose a team reviews one vacancy cohort and records these illustrative numbers:
| Stage | People | Conversion from prior stage |
|---|---|---|
| Completed applications | 200 | — |
| Meet essential criteria | 80 | 40% |
| Attend an interview | 40 | 50% |
| Receive an offer | 12 | 30% |
| Accept the offer | 9 | 75% |
| Join on the agreed date | 8 | 88.9% |
These figures are an example, not an industry benchmark. Here, only 40% of applicants meet the essential criteria. The team should first check whether the job advertisement explains those criteria clearly and whether the sourcing audience matches the role. The 50% interview attendance rate also merits review, while the 75% offer acceptance rate suggests the team should examine candidate feedback and offer terms. The numbers identify questions to ask; they do not tell the team the cause on their own.
4. Segment the funnel to make it actionable
- By role or job family: different roles have different requirements and candidate markets.
- By location: travel, shift, relocation and local availability may affect progression.
- By sourcing channel: compare qualified candidates and hires, not just clicks or applications.
- By recruiter or hiring team: use consistent definitions and account for role complexity and workload.
- By time period: compare like-for-like cohorts and note seasonal or process changes.
Use only the personal or demographic data that is appropriate and lawful for your context. Keep access restricted, aggregate reporting where practical, and do not use funnel metrics as a substitute for fair, job-related assessment.
5. Turn the dashboard into a weekly operating rhythm
- Review the funnel: identify the stage with the largest unexpected drop or delay.
- Check the evidence: review a small sample of candidate records and feedback before drawing a conclusion.
- Choose one change: for example, clarify one eligibility requirement or improve interview reminders.
- Assign an owner and date: record who will act and when the result will be reviewed.
- Compare the next cohort: assess whether the change improved the intended measure without harming candidate quality or fairness.
A spreadsheet can be enough for a small team. Keep one row per vacancy or candidate-stage event, use standard stage names, record timestamps consistently and avoid counting the same candidate twice in a stage. Larger teams may need an applicant tracking system or a reporting layer, but the definitions should remain clear either way.
Common mistakes to avoid
- Optimising for the number of applications instead of qualified candidates.
- Comparing teams that use different definitions of “hire,” “interview” or “time-to-fill.”
- Mixing candidates from different cohorts or reporting periods in one conversion calculation.
- Treating a low conversion rate as a performance verdict without investigating context.
- Using an unverified external benchmark as a target for every role, location or hiring model.
- Collecting more candidate data than is needed or retaining it without a clear policy.
Frequently asked questions
What are the most important recruitment funnel metrics?
Start with stage conversion rates, qualification rate, interview attendance, offer acceptance, time-to-fill or time-to-hire, source quality and cost per hire. Add a post-joining quality measure when reliable data is available. Choose metrics based on the decisions your team needs to make.
What is a good recruitment conversion rate?
There is no single rate that is appropriate for every role. Requirements, seniority, location, sourcing channel and hiring process all affect conversion. Establish a baseline from comparable roles and improve it while maintaining fair, job-related selection.
How often should HR review recruitment metrics?
Operational teams can review active funnel movement weekly; leadership may review monthly trends. Very small cohorts need caution because one or two candidates can change the percentage substantially.
Can a small company track recruitment funnel metrics in Google Sheets?
Yes. A structured sheet with consistent stage definitions, timestamps, source and outcome fields can work for a small team. Limit access to candidate information, validate entries and avoid storing unnecessary sensitive data.
Recruitment funnel measurement checklist
Tick each item as you verify it. Your progress updates here; you can return to any item before moving on.